RenderDoc Integration in Veldrid
This post describes an upcoming feature in Veldrid 4.6.0
Due to the complexity of modern graphics APIs and techniques, it can often be difficult to identify the source of rendering bugs. API’s like Vulkan include validation layers which help alert you to invalid usage at runtime. However, there is still a large class of programming errors which can result in problems like the dreaded “black screen”.
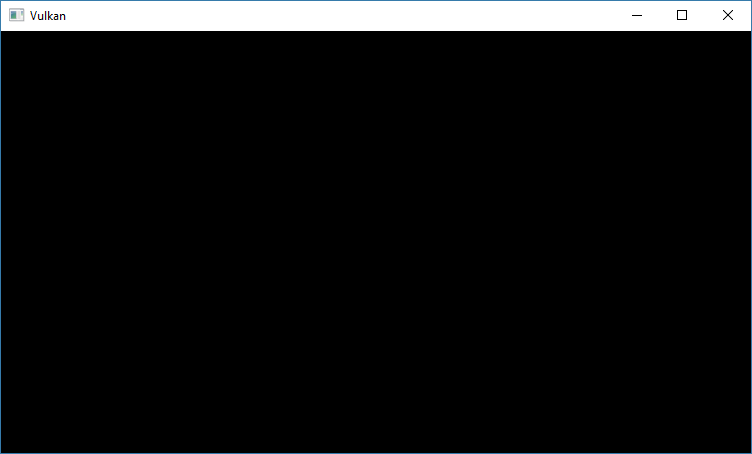
Where’s my triangle?
Tools like RenderDoc let you inspect fine-grained details about the state of your system at each draw call, which can save a lot of valuable time that might otherwise be spent agonizing over the details of your code. Problems like a bad depth test, bad face culling, or an invalid scissor rectangle can easily be identified and dealt with.
Although most of its functionality is easily accessible through the graphical UI, RenderDoc also exposes an in-application API. This allows you to configure and trigger RenderDoc captures from inside any part of your application. While RenderDoc’s graphical UI can only capture entire frames at once (which may include lots of extraneous information), the in-application API is more flexible, and can be used to capture a small portion of a frame, or some process that doesn’t occur strictly within a frame: perhaps a one-time render pass for an environment map (performed during startup), or a periodic compute pass. Capturing a smaller part of your code, and having the flexibility to start and stop the capture when you want, makes it much easier to isolate potentially problematic areas from each other.
Veldrid Support
The upcoming Veldrid 4.6.0 release includes a new helper library, Veldrid.RenderDoc, which is a simple .NET wrapper for RenderDoc’s in-application API. With it, you can configure, collect, and save RenderDoc captures from inside your application. Additionally, you can launch and manage the “Replay UI” from within your app to quickly debug a capture.
Veldrid.RenderDoc relies on the RenderDoc shared library being available on the library load path, or its path can be passed in explicitly:
public class RenderDoc
{
    public static bool Load(out RenderDoc renderDoc);
    public static bool Load(string renderDocLibPath, out RenderDoc renderDoc);
}
Once a RenderDoc instance is obtained, a variety of settings can be tweaked, and then captures can be taken quite easily:
RenderDoc.Load(out RenderDoc rd); // Load RenderDoc from the default locations.

rd.SetCaptureSavePath("my/special/path"); // Save captures into a particular folder.

rd.TriggerCapture(); // Capture the next frame.

rd.StartFrameCapture(); // Start capturing.
// Submit graphics or compute work to a Veldrid.GraphicsDevice.
rd.EndFrameCapture(); // Stop capturing and save.

rd.LaunchReplayUI(); // Launch the replay UI, with previous captures already loaded in.
In order for RenderDoc to successfully hook into the graphics API being used, a RenderDoc instance must be created before the Veldrid.GraphicsDevice that you wish to debug has been created. If your application allows it, you can re-create your GraphicsDevice after loading RenderDoc in order to allow it to hook the necessary functions. The Veldrid sample application does this, and allows RenderDoc to be loaded at any time, even after startup.
Platform Support
Veldrid.RenderDoc can be used on Windows and Linux. On Windows, RenderDoc.Load will attempt to load the shared library from the standard global install path, if it exists. On Linux, librenderdoc.so should be on the library load path, or the Load overload that accepts a full path should be used.
RenderDoc currently supports capturing and debugging Vulkan, Direct3D, OpenGL, and OpenGL ES applications. When using Veldrid, the Metal backend is the only one that RenderDoc cannot capture and debug.